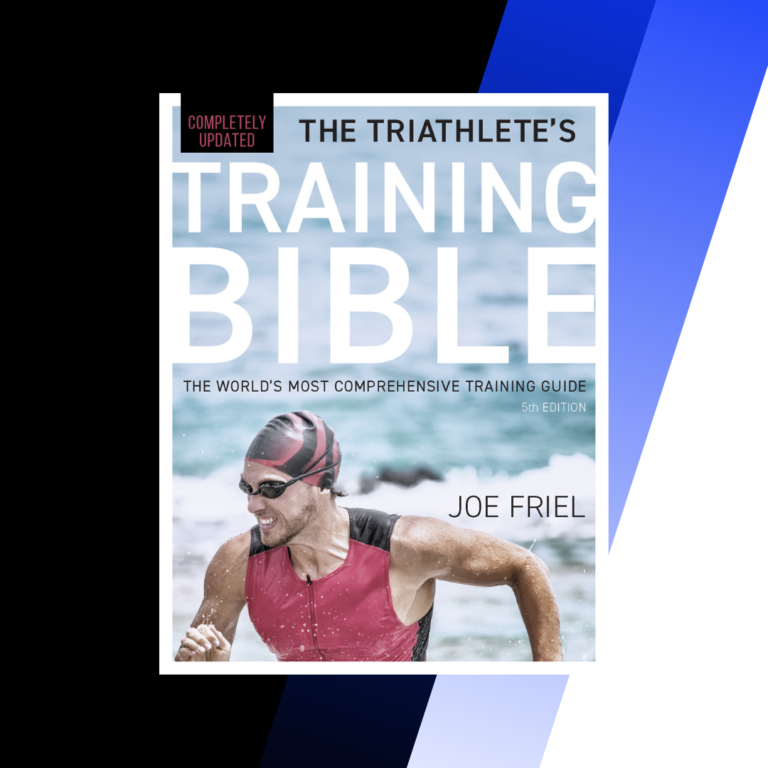
“Training is principally an act of faith.” –Franz Stampfl
For serious athletes, the purpose of training is to improve performance relative to a specific event – an A-priority race. Throughout the Base and Build periods you should be looking for indicators of improving readiness for this event. The closer you get to race day, the more important it is to have some idea of how well you may do. Not only does this build confidence, it also allows you to plan alternative strategies and consider your tactical responses given certain race situations.
Not all workouts throughout your preparation for the race are of equal value when it comes to predicting race readiness. The Base period merely prepares you for the challenging workouts of the Build period, which typically starts 10 to 12 weeks prior to race day. The workouts in Base are seldom good predictors. The Build weeks leading up to the start of the Peak period, or “taper,” is the most critical time in the season. How your training goes during the 8 or 9 weeks of Build largely determines how well you will race. Many of these Build sessions will tell you if progress is being made.
During Build you should be getting frequent feedback from training sessions that serve as indicators – predictors – of how you will do on race day. If all is going well these predictors should steadily improve so that by the time you start to taper, 2 or 3 weeks prior to the race, there is little doubt that you will be race-ready. The most important question is: What are good predictors?
Below I’ve listed several commonly used metrics – things that are measurable in training sessions – which are often used to get this “how am I progressing” feedback. Some metrics are better predictors than others. I’ve categorized them here as Weak, Moderate, and Strong Performance Predictors. I primarily rely on Strong predictors whenever possible. These are the most likely to give you reliable clues as to how race day will go. But occasionally I’ll check a Moderate predictor just because there hasn’t been a recent Strong indicator. Also, several Moderate indicators all indicating the same trend may well be a strong predictor.
We may disagree on whether or not a predictor is Weak, Moderate, or Strong. And, in fact, for some athletes who are training for unique events, what is usually a Moderate predictor may be Strong. Weak predictors are unlikely to make the leap all the way up to Strong.
The metrics I’ve listed below are not all-inclusive. They are the ones I commonly get from analysis software such as TrainingPeaks or WKO+.
There are other personal metrics I haven’t listed that for some may prove to be Strong performance predictors. For example, depending on the athlete and the event terrain, watts per kilogram (“w/kg”) or pounds per inch of height could be a Strong predictor. An athlete who is carrying excess weight potentially will race better simply by dropping a few pounds/kilograms even if all other metrics change. But for other athletes weight may not be limiting performance at all. All that’s included below are session-related data.
I frequently refer below to “key workouts.” I define these as the most important sessions in a Build period training week. They are usually either high intensity, long duration, or both. They generally fall into the category of “advanced abilities” as described in my Training Bible books: muscular endurance, anaerobic endurance, and sprint power. Race simulation sessions are always key workouts. Other key sessions may be intervals, repeats, hill training, or group workouts – whatever is critical to your preparation.
Weak Performance Predictors
● Max or lactate threshold heart rate
● Average cadence for a workout or week
● Weekly miles/kilometers/hours/TSS
● Calories/kilojoules expended/produced per week
● Feet or meters of vertical ascent in a week (“VAM”)
● Time in heart rate/power/pace/speed zones per week
Moderate Performance Predictors
● Minimal heart rate increase or power fade at aerobic event intensity – “Decoupling” (P:HR)
● Improving power/pace relative to aerobic heart rate over time – “Efficiency Factor” (EF)
● “Performance Management Chart” (PMC) data – “CTL,” “ATL,” and “TSB.”
● Distance/duration of key workouts
● Event-specific pacing of key workouts (“Variability Index”)
● Power Profile comparisons
● Event-specific calories/kilojoules expended/produced in key workouts
● Event-specific “Training Stress Score” (TSS) for key workouts
● Previous performance in the same event
● Time in power/pace zones in key workouts
● “Rating of Perceived Exertion” (RPE) relative to power/pace in key workouts
Strong Performance Predictors
● Functional Threshold Power/Pace (“FTP”)
● Peak power/pace for event-critical durations (6 sec, 5 minutes, 30 minutes, 3 hours, or etc)
● The accumulation of seasonal-best peak power/pace in the last few weeks of Build
● Event-specific power/pace for an event-specific duration in key workouts
● Recent tune-up race performance


